Every transaction on a public blockchain is recorded permanently. Every single one. The amounts, the wallet addresses, the timestamps — all of it sitting there, readable by anyone who knows where to look.
On-chain analysis is the practice of actually looking.
It means taking that raw blockchain data — wallet holdings, transaction histories, fund flows — and turning it into useful intelligence. Traders use it to find edges. Researchers use it to track market trends. And compliance professionals? We use it to catch the things that people don't want us to see.
If you work in crypto and you're not using on-chain data, you're flying blind. The blockchain is the most transparent financial ledger ever created — and the tools to read it are free.
The Building Blocks: What On-Chain Data Actually Shows You
On-chain analysis boils down to two fundamental things: what wallets hold, and where funds move. Everything else — exchange flows, whale alerts, network health metrics — builds on those two pillars.
Wallet Holdings
Unlike a bank account, blockchain wallet balances are public. You can see exactly how much ETH, BTC, or any token a specific address holds right now, and how much it held at any point in the past. When tools like Arkham link those anonymous addresses to real entities — a fund, an exchange, a public figure — the picture gets very interesting very fast.
Transaction Analysis
Every transaction has a unique hash, a sender, a recipient, a timestamp, and an amount. Chain it all together and you can follow money from origin to destination, through however many hops someone tries to use to obscure the trail.
For traders, that means spotting patterns — is a successful fund accumulating a position? For compliance professionals, it means something more important: following the money when someone doesn't want it followed.
Exchange Flows: The Signal Most People Miss
This is where on-chain analysis gets genuinely powerful.
Exchange flows track the movement of tokens between personal wallets and exchange wallets. The logic is straightforward:
| Direction | What It Means | Signal |
|---|---|---|
| Crypto → Exchange | Someone is preparing to sell | Bearish pressure |
| Crypto ← Exchange | Someone is taking custody to hold | Bullish conviction |
| Stablecoin → Exchange | Dry powder ready to buy | Potential buying wave |
| Stablecoin ← Exchange | Converting out of the market | Risk-off sentiment |
At scale, these flows reveal market sentiment before price movements happen. In 2022 and 2023, massive USDC inflows to exchanges signalled that people were converting crypto back to dollars — a bearish indicator that on-chain analysts spotted well before the price caught up.
Large, sudden transfers to exchanges — especially from wallets with no prior history — are exactly the kind of patterns that should trigger enhanced due diligence. If you're running an exchange or a VASP under MiCA, monitoring inbound flows isn't optional. It's your job.
Whale Alerts and Why They Move Markets
"Whales" are wallets holding large amounts of a specific cryptocurrency. There's no fixed threshold — you're a whale relative to the size of the market you're in.
When a whale moves, the market often follows.
A dormant Bitcoin wallet suddenly sending 400 BTC to Binance after a decade of inactivity? The lag between the transfer and the actual sale creates a window — on-chain analysts who catch it early can position accordingly.
Platforms like Arkham let you set custom alerts for specific wallets or transaction types. You pick the wallet, you pick the threshold, and you get notified the second something moves.
The Institutional Layer: ETFs and Corporate Treasuries
Two developments have made on-chain analysis significantly more relevant to the mainstream.
Spot Bitcoin ETFs — since the US approval in 2024, institutional investors now hold Bitcoin through publicly tracked ETF wallets. BlackRock's IBIT, Fidelity's FBTC — their accumulation (or distribution) is visible on-chain in near real-time. You no longer need to wait for quarterly filings. The blockchain tells you what institutions are doing today.
Corporate treasuries — companies like Strategy (formerly MicroStrategy) hold Bitcoin as a reserve asset, and their wallet addresses are publicly known. On-chain analysis lets you verify their holdings independently, without relying on press releases or earnings calls.
The traditional finance world — which historically operated behind closed doors — now has a transparency layer it's never had before. Corporate claims about crypto holdings can be verified independently. Discrepancies between what's declared and what's on-chain become auditable.
On-Chain vs Technical vs Fundamental Analysis
These three approaches answer different questions. Here's how they compare:
| On-Chain Analysis | Technical Analysis | Fundamental Analysis | |
|---|---|---|---|
| Looks at | Blockchain data — wallets, flows, network activity | Price charts — candles, support, moving averages | Qualitative factors — team, revenue, product-market fit |
| Tells you | Who's buying, selling, and where money flows | Historical price patterns and potential levels | Whether the asset has intrinsic value |
| Best for | Understanding behaviour behind price moves | Timing entries and exits | Long-term investment thesis |
| Data source | Public blockchain | Exchange price feeds | Reports, filings, research |
| Crypto-specific? | Yes — unique to blockchain | No — works on any asset | Adapted from tradfi |
They're complementary, not competing. A technical analyst might see a resistance level. An on-chain analyst sees that three whale wallets just moved 50,000 ETH to Coinbase. Both tell you something. The on-chain data tells you why the move is about to happen.
The Network-Level View: Macro On-Chain Indicators
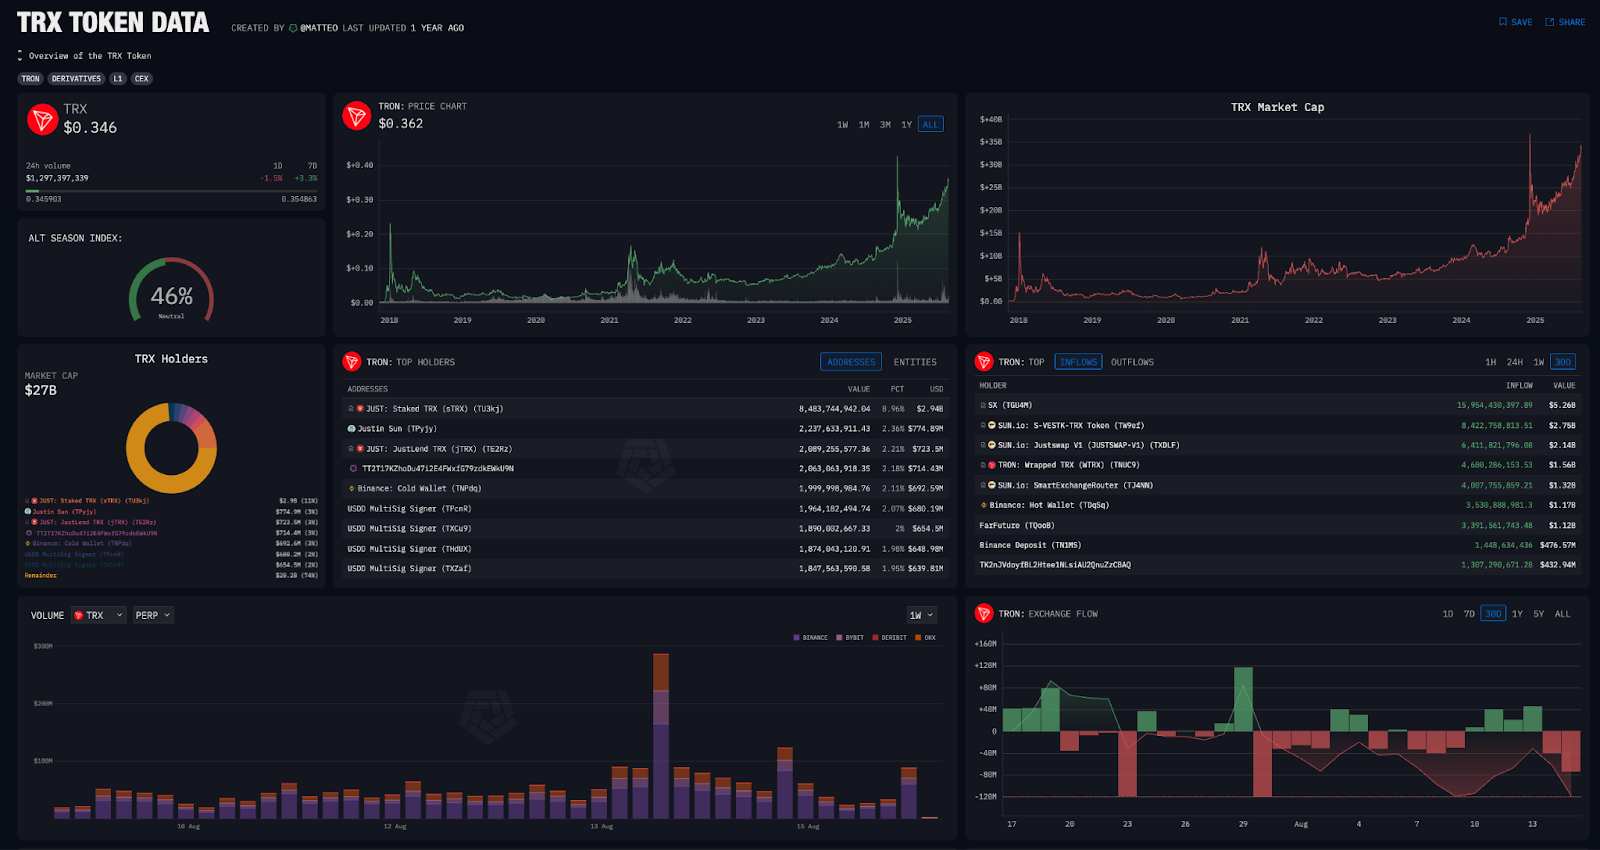
Beyond individual wallets and transactions, on-chain data reveals the health of entire blockchain networks. These macro indicators are the crypto equivalent of economic data.
For professionals monitoring a specific chain or protocol: these metrics tell you whether the ecosystem you're operating in is growing, stable, or showing signs of stress. They're part of your environmental risk assessment.
The Tools: Where to Actually Do This
You don't need to read raw blockchain data yourself. Several platforms make on-chain analysis accessible:
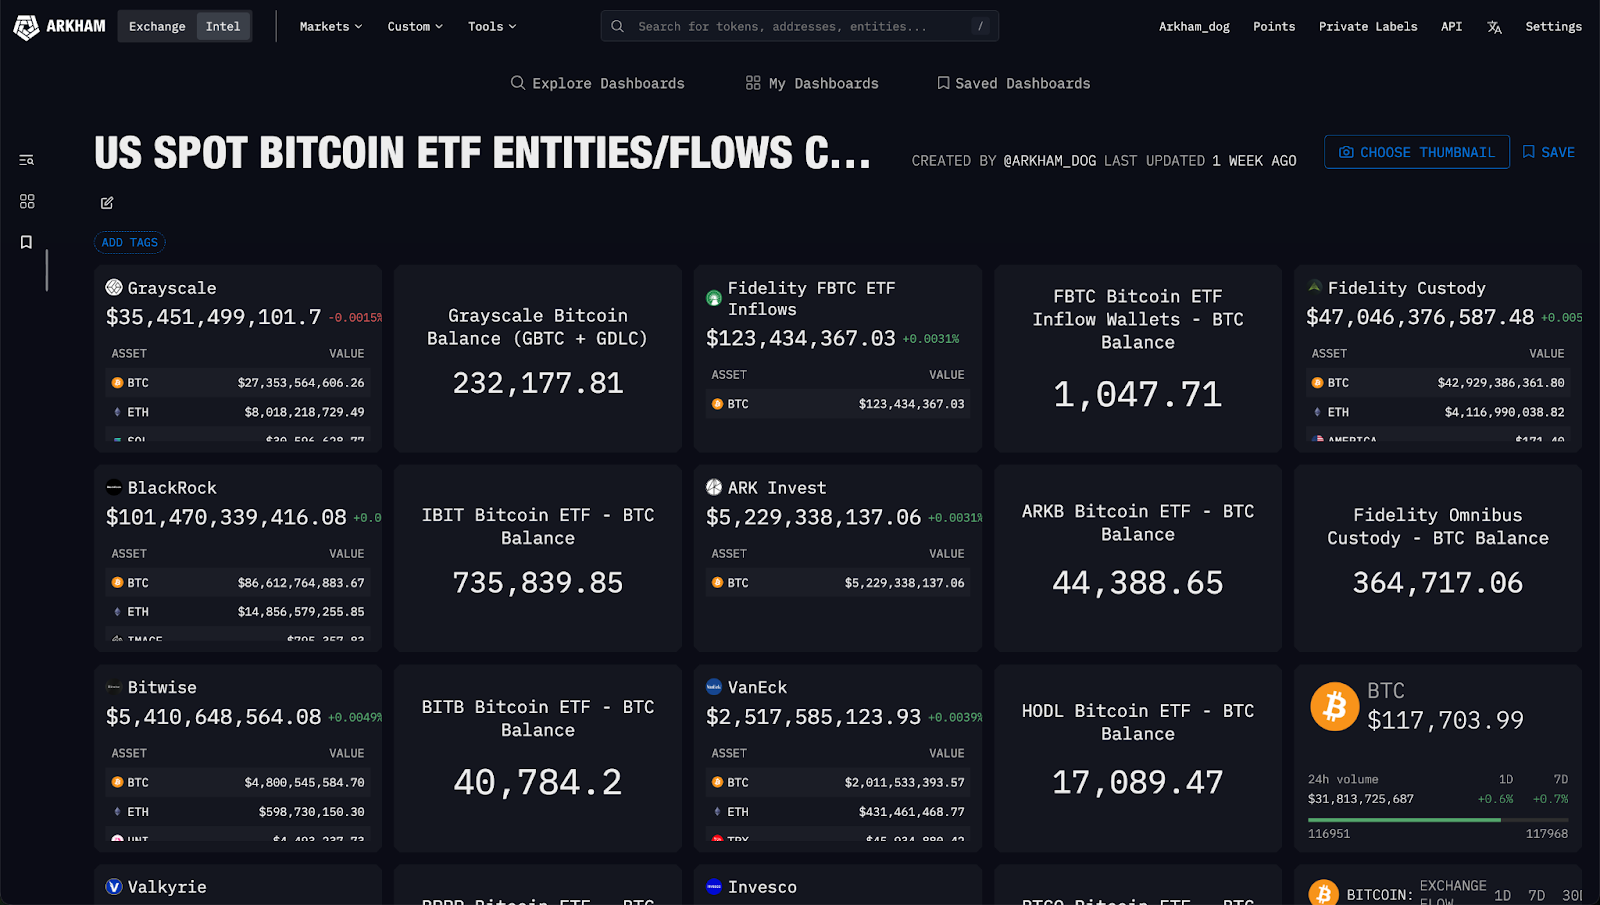
Arkham — entity-level intelligence. Links wallet addresses to real people and organisations using AI. Portfolio tracking, alerts, transaction visualization. The compliance angle here is strong: entity identification is half the AML battle.
Chainalysis — the industry standard for compliance teams. Transaction monitoring, risk scoring, investigation tools. If you're a VASP, you probably already use it or should.
Etherscan — the classic block explorer for Ethereum. Raw transaction data, contract interactions, token transfers. Free and granular.
Glassnode — macro on-chain metrics. Charts, dashboards, and indicators for Bitcoin and Ethereum. Popular with institutional analysts.
| Tool | Best For | Compliance Use | Price |
|---|---|---|---|
| Arkham | Entity tracking, wallet alerts | Entity identification, wallet monitoring | Free tier + paid |
| Chainalysis | Transaction monitoring, risk scoring | AML/KYC, investigation, SAR filing | Enterprise pricing |
| Etherscan | Raw blockchain data, contract verification | Transaction verification, address checks | Free |
| Glassnode | Macro network metrics, market analysis | Environmental risk assessment | Free tier + paid |
Flor's Take
Here's what I think most people get wrong about on-chain analysis: they treat it as a trading tool only. It's not. It's a transparency tool.
If you're in compliance, on-chain data is the most powerful weapon you have. It's the one area where crypto actually outperforms traditional finance in terms of auditability. Try asking a bank for real-time transaction data on a suspicious account. Now compare that to pulling up a wallet on Arkham and seeing every transaction, every token, every counterparty — instantly.
The industry built for "privacy" and "decentralisation" created the most transparent financial system in history. On-chain analysis is how you read that transparency. Whether you use it for trading, for research, or for catching bad actors — it's a skill worth having.
And honestly? If you're working in crypto compliance and you haven't explored these tools yet, start today. Not tomorrow. The data is there. It's public. It's permanent. And it's telling you things that no quarterly report ever will.
What to Do Next
If you're new to this, here's your action plan:
What aspect of on-chain analysis do you want me to break down in more detail? Drop me a message.
This article is educational content only and does not constitute financial, legal, or investment advice. Always conduct your own research and consult qualified professionals before making decisions based on blockchain data.